Earthquake Risk Map USA
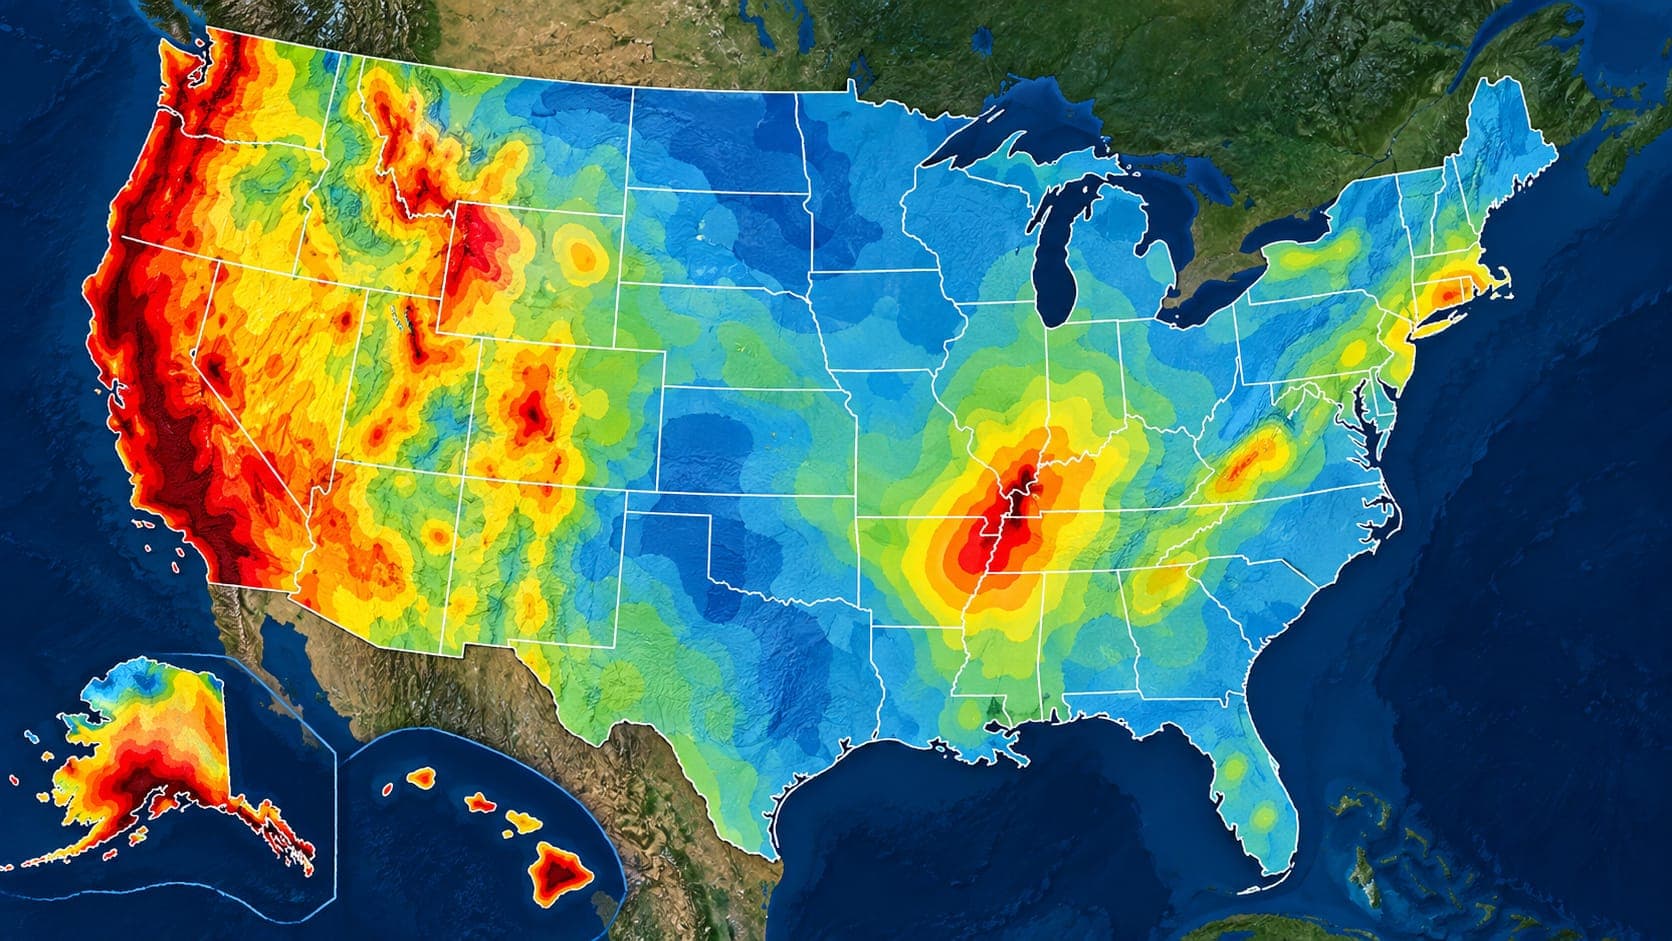
Most searches for an earthquake risk map of the USA lead to the same source: the USGS National Seismic Hazard Model. It is the map behind building codes, insurance studies and emergency planning across the country.
Strictly speaking, it is a hazard map, not a risk map. This article explains the difference, how to read the colors, which regions stand out, and where to go if you want a true risk map that includes people and buildings.
Quick answer
The USGS National Seismic Hazard Model maps the chance of strong earthquake shaking across the United States, usually as the shaking level with a small chance of being exceeded in 50 years. The highest hazard is along the West Coast, in Alaska and Hawaii, in parts of the Intermountain West, and around New Madrid and Charleston. For risk, which adds people and buildings, see FEMA's National Risk Index.
Recent earthquakes across the United StatesHazard map or risk map?
Earthquake hazard is about nature: how likely it is that the ground at a place will shake strongly. Earthquake risk is about consequences: how likely it is that people will be hurt or property damaged. Risk combines hazard with exposure, meaning what is there, and vulnerability, meaning how easily it is damaged.
A remote area on an active fault can have high hazard but low risk, because few people or buildings are there. A city with moderate hazard but many old, unreinforced buildings can have high risk. Both kinds of maps are useful, but they answer different questions.
The USGS National Seismic Hazard Model
The USGS updates the National Seismic Hazard Model every few years. It combines information on known faults, the history of past earthquakes, how fast the ground is deforming, and how shaking weakens with distance and is affected by local ground conditions. The result is a statistical estimate of how strong shaking is likely to be at every location.
The 2023 update was the first to cover all 50 states in one model. In summarizing it, the USGS said that nearly three-quarters of the United States could experience damaging earthquake shaking. Engineers use the model's values in building codes, which is why buildings in high-hazard areas must be designed to resist stronger shaking.
How to read the map
The most common version of the map shows a level of ground shaking, often peak ground acceleration as a fraction of the acceleration of gravity, that has about a 2 percent chance of being exceeded in 50 years at each location. Darker or warmer colors mean stronger expected shaking. Simplified public versions instead show the chance of damaging shaking over a period such as 100 years.
A few tips help you read it correctly:
- Check the legend and the time period. A 2 percent chance in 50 years describes rare, strong shaking, not what to expect every year.
- Pale areas are lower hazard, not zero hazard. Damaging earthquakes occasionally occur in low-hazard regions.
- The map is smoothed and regional. Local soil, slopes and fill can make shaking at your exact site stronger or weaker than the map suggests.
- It does not predict when or where the next earthquake will happen; it summarizes long-term probabilities.
The highest-hazard regions
Several regions stand out on the national map:
| Region | Main reason |
|---|---|
| California | The San Andreas and many other active faults along the Pacific-North American plate boundary |
| Pacific Northwest | The Cascadia Subduction Zone plus deep and shallow crustal faults |
| Alaska | The Alaska-Aleutian subduction zone; site of the M9.2 1964 earthquake |
| Hawaii | Volcanic activity and large flank faults on the Island of Hawaii |
| Intermountain West | Faults such as the Wasatch Fault in Utah and faults across Nevada, Idaho and Montana |
| New Madrid Seismic Zone | Central Mississippi Valley; large earthquakes in 1811-1812 |
| Charleston, South Carolina | A damaging earthquake of about M7 in 1886 |
Why the central and eastern U.S. matter
The central and eastern United States have far fewer earthquakes than the West, but when they do occur, shaking travels much farther. The older, colder and less fractured rock in the East carries seismic energy efficiently, so a moderate earthquake can be felt over a much larger area than a similar one in California. The 2011 magnitude 5.8 earthquake in central Virginia, for example, was felt across much of the East Coast.
Many buildings in the East were also built before modern seismic codes, which can raise risk even where hazard is moderate.
Where to find a true risk map
If you want to know about risk, not just hazard, FEMA's National Risk Index combines natural hazard data, including earthquakes, with estimates of expected losses, social vulnerability and community resilience, mapped by county and census tract. State geological surveys and emergency management agencies also publish local maps of Liquefaction, Landslide and Tsunami zones, which can matter as much as the national shaking map.
For a property, the most useful steps are to check local hazard zone maps, learn how your building was constructed, and follow your local emergency management agency's guidance.
Using the map alongside real earthquakes
Hazard maps describe long-term possibilities. To see what is actually happening, open the EQRadar live map of the U.S., which shows earthquakes reported by the USGS, or explore past events in the history view. EQRadar's outlook offers a separate statistical view based on past rates of earthquakes in an area; like the hazard model, it is a probability, not a prediction.
Frequently asked questions
Which state has the highest earthquake risk?
California has the highest earthquake risk in terms of expected losses because it combines high hazard with large populations and economies. Alaska has the most frequent large earthquakes, but far fewer people are exposed.
Does a low-hazard area mean I do not need to prepare?
Lower hazard means strong shaking is less likely, not impossible. Basic preparation such as securing heavy furniture and keeping emergency supplies is inexpensive and also helps in other emergencies.
How often is the U.S. earthquake hazard map updated?
The USGS updates the National Seismic Hazard Model every several years as new research on faults, earthquake rates and ground shaking becomes available. The most recent full update was released in 2023.
Is the hazard map the same as a ShakeMap?
No. A hazard map shows long-term probabilities of shaking. A ShakeMap shows the shaking that actually happened in one specific earthquake. You can browse ShakeMaps on EQRadar's shaking page.
Key takeaway
The USGS National Seismic Hazard Model is the standard earthquake hazard map for the USA. It shows the long-term chance of strong shaking, highest in the West, Alaska, Hawaii, New Madrid and Charleston. Risk also depends on people and buildings, so use FEMA's National Risk Index and local hazard maps for a fuller picture.
Sources
- Earthquake Hazards — U.S. Geological Survey
- National Risk Index — Federal Emergency Management Agency
- Earthquake Hazards Program — U.S. Geological Survey