San Andreas Fault Map
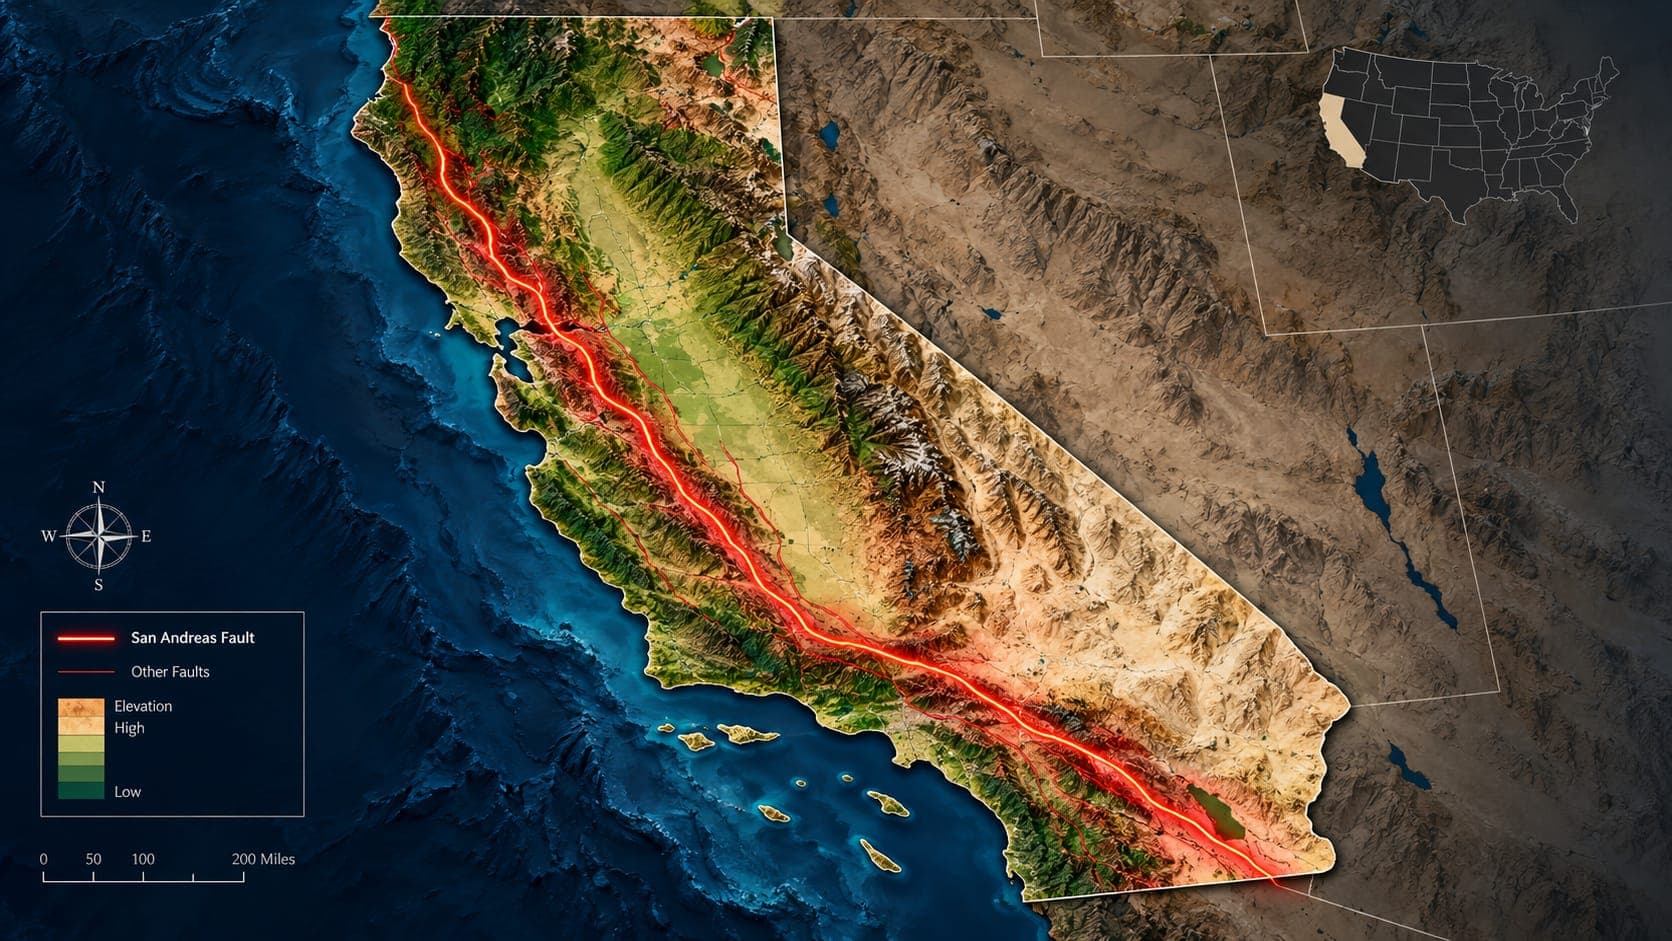
Searching for a San Andreas Fault map turns up everything from careful scientific databases to rough sketches with a single red line across California. The good maps are free and public, but they contain symbols and terms that are easy to misread.
This guide explains where official fault maps come from, how to read them, and what they can and cannot tell you about a specific home or street.
Quick answer
The most reliable San Andreas Fault maps come from the USGS Quaternary Fault and Fold Database and the California Geological Survey Fault Activity Map, both free online. For property-level questions in California, check the official Alquist-Priolo Earthquake Fault Zone maps, which mark strips along active faults where special geologic studies are required before building.
Earthquakes near the San Andreas FaultWhere the San Andreas runs
On any statewide map, the San Andreas is the long line running about 1,200 kilometers (roughly 750 miles) from the Salton Sea area near the Mexican border to Cape Mendocino on the north coast. Going from south to north, it passes along the Coachella Valley, through the Cajon Pass between the San Bernardino and San Gabriel Mountains, along the north side of the San Gabriels near Palmdale, across the Carrizo Plain, through Parkfield and Hollister, along the San Francisco Peninsula, through Tomales Bay at the edge of Point Reyes, and past Point Arena before running offshore to its end near Cape Mendocino.
In the Transverse Ranges north of Los Angeles, the fault bends to a more east-west direction. This area is called the Big Bend, and it shows up clearly on any good map.
The official map sources
Two public sources are the foundation for most trustworthy fault maps:
- USGS Quaternary Fault and Fold Database: a nationwide database of faults believed to have moved in roughly the last 1.6 million years, with an interactive online map and a written summary for each fault or section.
- California Geological Survey (CGS) Fault Activity Map of California: a statewide map showing faults colored by how recently they are thought to have moved, with an interactive web version.
- CGS Earthquake Zones of Required Investigation: the official regulatory maps, including Alquist-Priolo fault zones, searchable by address.
How to read fault lines and symbols
Fault maps use line styles to show how well a fault's position is known. A solid line usually means the fault trace is well located, a dashed line means its position is approximate, and a dotted line means it is concealed under younger sediments or inferred. Always check the legend, because conventions vary between maps.
Color usually shows age of most recent movement. Faults that moved in historic time or in roughly the last 11,000 to 15,000 years are generally treated as the most active and get the most attention. Older faults are shown in other colors. A fault being on the map does not by itself mean it is dangerous; recency and rate of movement matter.
Some maps also mark the type of fault with small symbols: arrows for sideways (strike-slip) motion, or triangles or teeth on the upper block of a thrust fault. Along most of the San Andreas, you will see arrows pointing in opposite directions, showing right-lateral motion.
A fault is a zone, not a single line
At the scale of a statewide map, the San Andreas looks like one clean line. Up close, it is often a zone tens to hundreds of meters wide containing several parallel or branching breaks. In places, the main trace has moved over time, and some strands may be buried.
This matters for reading maps. A line on a small-scale map can be off by a considerable distance on the ground, so never use a statewide map, an online sketch or a general-purpose map app to judge whether a specific house sits on the fault. Use the official zone maps and, for important decisions, a licensed engineering geologist.
Alquist-Priolo Earthquake Fault Zones
After the 1971 San Fernando earthquake ruptured the ground surface through a developed area, California passed the Alquist-Priolo Earthquake Fault Zoning Act in 1972. Under the act, the State Geologist maps regulatory zones along faults that are considered active and well defined. The zones are usually a few hundred meters wide on either side of the mapped trace.
Within a zone, most new construction intended for human occupancy requires a site investigation to make sure buildings are not placed across an active fault trace. Sellers of property inside a zone must disclose that fact to buyers. The zones address surface fault rupture only; they do not show how strongly the ground will shake, which affects a far larger area.
What a fault map does not show
A fault map shows where the ground can break, not how hard it will shake. Strong shaking spreads tens of kilometers from a large rupture, and local soil can amplify it. Other hazards such as Liquefaction and landslides have their own zone maps. For overall shaking hazard, see our article on the earthquake risk map for the USA.
Fault maps also do not show every fault. Some faults, called blind thrusts, never reach the surface and were discovered only after they produced earthquakes. Our article on earthquake fault lines in California describes several of them.
Comparing fault maps with recent earthquakes
EQRadar does not draw fault lines, but you can open the live map near the San Andreas or search the earthquake history and compare the pattern with an official fault map. You will often see small earthquakes lined up along the creeping section in central California and clustered on nearby faults, while long locked stretches can look quiet. Quiet on a map does not mean safe; it often means the fault is locked and storing strain.
Frequently asked questions
How can I tell if my house is on the San Andreas Fault?
Look up your address on the California Geological Survey's Earthquake Zones of Required Investigation maps, which show Alquist-Priolo fault zones. Property disclosures should also mention it. For a definitive answer about a specific lot, consult a licensed engineering geologist.
Why do different maps show the fault in slightly different places?
Maps are made at different scales and from different data. A statewide map simplifies a complex zone into one line, while detailed maps show multiple strands. Use the most detailed official source for anything location-specific.
Is it dangerous to live inside an Alquist-Priolo zone?
The zone means there is a mapped active fault nearby that could break the ground surface. New buildings in the zone must be sited away from fault traces. Shaking risk exists well outside the zone too, so preparedness matters either way.
Can I see the San Andreas Fault in person?
Yes. In the Carrizo Plain in central California, the fault is clearly visible from the air and on the ground, with stream channels offset sideways where they cross it. Fences and curbs bent by creep can also be seen in towns such as Hollister.
Key takeaway
Use the USGS Quaternary Fault and Fold Database and the CGS Fault Activity Map for an accurate San Andreas Fault map, read the legend for line style and age, and rely on official Alquist-Priolo zone maps, not general maps, for property questions. Remember that fault maps show where the ground can break, while shaking reaches much farther.
Sources
- Faults (Quaternary Fault and Fold Database) — U.S. Geological Survey
- Fault Activity Map of California — California Geological Survey
- California Geological Survey — California Department of Conservation